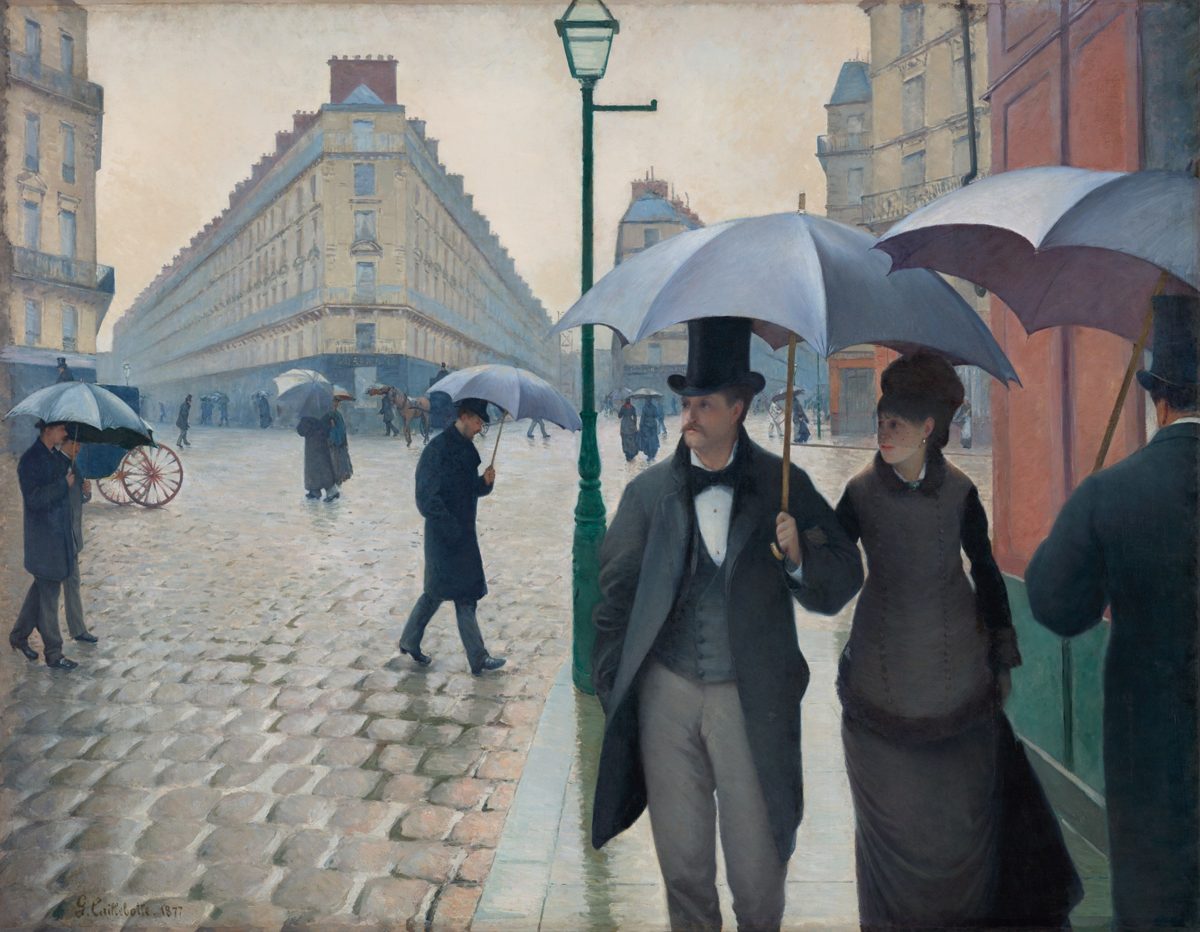
A study against the weather record
Gustave Caillebotte
Paris Street; Rainy Day
The title says rain. Did it rain in Paris in the months the picture could have been painted?
“Temps de pluie” partially agreesDay unknown
The Nephos method
How this study was read
The method in fullWhat is written
The rue de Turin at the rue de Moscou, Paris, 1877, finished before the exhibition opened on 4 April.
Rue de Paris; temps de pluie
The painting’s title in the 1877 exhibition catalogue, as the Art Institute of Chicago records itthe intersection made by the rue de Turin and the rue de Moscou.
Critics in 1877, quoted by the Art Institute of ChicagoAs the work is dated 1877 and was first exhibited in April of that year in the third Impressionist exhibition
Art Institute of Chicago scholarly catalogue
Records of those days
- Paris-Montsouris rain gauge and thermometerMétéo-France daily rain, lowest and highest temperature. 6.6 km from the crossing, now the place de Dublin.
Not found or not yet searched
- Paris newspapers for early 1877 have not yet been searched: the Gallica archive blocked an automated search on 23 September 2026.
- No dated letter from Caillebotte about the weather has been located.
Each claim tested
- “temps de pluie”, rainy weather in a Paris street. Between 1 January and 4 April 1877 rain fell at Montsouris on 65 of 94 days, 40 of them with at least 1 mm: 164.7 mm in all. The wettest day was 20 March, with 19.5 mm. The 1991–2020 average is 29.7 such days and 140.8 mm.
- “the hint of sun after the rain”, the museum catalogue’s reading of the light once the painting was cleaned. The station kept no sunshine record, and rain fell on so many days that no single one stands out. Kirk Varnedoe, quoted in the same catalogue, saw “almost shadowless grey light”.
- The day painted. The catalogue describes an on-site sketch and a canvas probably worked on the studio wall; no session is dated.
Verdict
- Partially agrees“temps de pluie” Rain fell on most days the painting could have been made, 6.6 km away; no record ties the painted rain to a day.
- Unknown“the hint of sun after the rain” No sunshine or cloud was recorded, so the light cannot be tested.
- UnknownThe day painted. The painting was composed from a sketch; no day can be picked.
What this cannot tell you. The Montsouris gauge stands on the southern edge of Paris, not at the street corner. A count of wet days describes a season; it cannot date a scene. The painting was composed in stages, so its weather may combine more than one day.
Step 2 · Records of those days
Ninety-four days at Montsouris
The painting is signed 1877 and hung in the third Impressionist exhibition, which opened on 4 April 1877. So it was finished inside these 94 days. Each bar is one day’s rain in the Paris-Montsouris gauge, 6.6 km from the crossing Caillebotte painted, now the place de Dublin. No day is missing.
- 65
- days with any rain, of 94
- 40
- days with at least 1 mm
- 164.7
- mm in all
- −6.2
- °C, the coldest morning, 12 March
Every day, rain and temperature
| 1877 | Rain, mm | Lowest, °C | Highest, °C |
|---|---|---|---|
| 1 January | 0.0 | 8.5 | 13.5 |
| 2 January | 0.4 | 6.5 | 10.7 |
| 3 January | 0.0 | 7.8 | 13.7 |
| 4 January | 7.4 | 7.1 | 11.6 |
| 5 January | 2.4 | 6.6 | 10.8 |
| 6 January | 1.2 | 5.7 | 11.4 |
| 7 January | 4.1 | 7.7 | 14.1 |
| 8 January | 0.4 | 7.9 | 15.5 |
| 9 January | 0.0 | 8.1 | 14.9 |
| 10 January | 0.4 | 7.1 | 14.4 |
| 11 January | 1.7 | 5.0 | 9.4 |
| 12 January | 0.1 | 1.6 | 6.5 |
| 13 January | 0.1 | 0.2 | 5.2 |
| 14 January | 3.2 | 2.1 | 9.3 |
| 15 January | 0.6 | 3.6 | 9.4 |
| 16 January | 0.0 | −0.9 | 8.5 |
| 17 January | 2.6 | 1.8 | 8.2 |
| 18 January | 0.2 | 4.9 | 9.0 |
| 19 January | 0.1 | 5.9 | 13.1 |
| 20 January | 1.6 | 4.6 | 9.5 |
| 21 January | 0.0 | −1.4 | 3.6 |
| 22 January | 0.0 | −1.9 | 1.3 |
| 23 January | 0.0 | −4.9 | 6.0 |
| 24 January | 0.0 | −5.6 | 2.4 |
| 25 January | 2.4 | −1.2 | 9.1 |
| 26 January | 1.4 | 0.9 | 6.4 |
| 27 January | 0.6 | −1.4 | 5.3 |
| 28 January | 5.2 | 4.1 | 11.8 |
| 29 January | 0.2 | 2.5 | 8.8 |
| 30 January | 5.6 | 3.5 | 8.7 |
| 31 January | 0.3 | 2.6 | 8.5 |
| 1 February | 5.9 | 3.6 | 10.3 |
| 2 February | 0.0 | 6.5 | 12.7 |
| 3 February | 0.6 | 3.5 | 11.1 |
| 4 February | 0.8 | 1.9 | 10.0 |
| 5 February | 0.0 | −1.6 | 8.8 |
| 6 February | 0.0 | 4.9 | 11.2 |
| 7 February | 0.6 | 8.0 | 13.5 |
| 8 February | 3.1 | 5.0 | 12.3 |
| 9 February | 0.3 | 6.3 | 11.9 |
| 10 February | 0.0 | 7.8 | 12.3 |
| 11 February | 0.0 | 7.8 | 10.9 |
| 12 February | 3.6 | 5.8 | 12.0 |
| 13 February | 6.7 | 7.7 | 13.9 |
| 14 February | 0.0 | 9.8 | 12.6 |
| 15 February | 0.0 | 5.2 | 13.3 |
| 16 February | 2.4 | 4.2 | 8.4 |
| 17 February | 0.0 | 0.6 | 9.8 |
| 18 February | 0.0 | 3.3 | 9.8 |
| 19 February | 4.6 | 5.9 | 8.7 |
| 20 February | 7.1 | 2.1 | 7.8 |
| 21 February | 0.6 | 1.5 | 6.7 |
| 22 February | 2.5 | 0.4 | 6.3 |
| 23 February | 0.1 | 1.0 | 4.1 |
| 24 February | 0.4 | 0.9 | 8.3 |
| 25 February | 1.4 | 7.7 | 11.4 |
| 26 February | 1.0 | 2.7 | 10.7 |
| 27 February | 1.2 | −0.7 | 8.3 |
| 28 February | 0.0 | −3.3 | 3.5 |
| 1 March | 0.0 | −2.6 | 4.8 |
| 2 March | 2.5 | −0.8 | 5.0 |
| 3 March | 0.1 | 4.5 | 11.6 |
| 4 March | 2.3 | 5.4 | 10.2 |
| 5 March | 0.9 | 3.6 | 8.2 |
| 6 March | 2.7 | 0.1 | 6.7 |
| 7 March | 1.7 | −0.2 | 4.9 |
| 8 March | 0.4 | 0.0 | 6.1 |
| 9 March | 0.0 | −0.9 | 4.6 |
| 10 March | 0.0 | −3.6 | 2.8 |
| 11 March | 0.0 | −4.8 | 1.9 |
| 12 March | 0.1 | −6.2 | 5.7 |
| 13 March | 0.8 | 5.1 | 11.3 |
| 14 March | 0.9 | 7.6 | 10.4 |
| 15 March | 0.0 | 6.6 | 11.9 |
| 16 March | 2.0 | 5.6 | 11.8 |
| 17 March | 3.7 | 2.1 | 10.7 |
| 18 March | 0.0 | −0.5 | 9.7 |
| 19 March | 0.0 | 0.4 | 9.5 |
| 20 March | 19.5 | 2.6 | 12.3 |
| 21 March | 1.8 | 1.5 | 7.5 |
| 22 March | 0.0 | −0.1 | 7.6 |
| 23 March | 5.4 | −0.9 | 9.2 |
| 24 March | 2.7 | 4.0 | 11.0 |
| 25 March | 5.5 | 5.0 | 11.9 |
| 26 March | 4.0 | 5.5 | 11.0 |
| 27 March | 7.2 | 4.5 | 12.0 |
| 28 March | 0.0 | 3.2 | 15.8 |
| 29 March | 1.8 | 8.9 | 17.6 |
| 30 March | 4.5 | 7.8 | 15.7 |
| 31 March | 0.0 | 3.8 | 15.1 |
| 1 April | 0.0 | 5.0 | 12.6 |
| 2 April | 0.2 | 8.3 | 14.5 |
| 3 April | 1.9 | 5.3 | 17.6 |
| 4 April | 7.0 | 8.2 | 22.2 |
Step 3 · The claim tested
1877 against 152 years
The same 94 days in every year from 1873 to 2024. 13 years had more rain days than 1877 and one other had as many. The 1991–2020 average is 29.7. A wet start to 1877, then, but not an exceptional one.
Step 4 · Why the verdict stops at the season
What a rain gauge cannot reach
The museum’s catalogue describes a picture composed in stages, and two readings of its light. Neither can be checked against a gauge that measured rain once a day.
“the initial on-site stage of Caillebotte’s sketch”
Art Institute of Chicago, scholarly catalogue
“the most logical arrangement would have been to tack the loose canvas to the studio wall”
Art Institute of Chicago, scholarly catalogue
“the hint of sun after the rain”
The same catalogue, on the light after the painting was cleaned
“The almost shadowless grey light of the sky”
Kirk Varnedoe, quoted in the same catalogue
Sources
Every source on this page
Each file was downloaded and given a fingerprint (its sha256). The page is rebuilt from these files and will not build if a fingerprint changes, so every number above comes from them rather than being typed in.
- Météo-France daily climatological data, Paris, before 1949
sha256 04ccefd0095bb629f1e44434308eef0770693764fc533b96f5cc3ad4553d73f8 - Météo-France daily climatological data, Paris, 1950–2024
sha256 128d559d01d1f4633e3d1cbb12da8f33e48f6e6e2cb803c3b6421ed86f5ce136 - OpenStreetMap Nominatim: Place de Dublin, Paris
sha256 901deb2007427ff3a77f4936bbcd9e63c19523f1cfb92ff1b54f95e65e9c430f - Art Institute of Chicago, Caillebotte scholarly catalogue, cat. 2
- BnF, Degas en noir et blanc, chronology

Look closer
Where is the rain in the picture?
A close reading of wet stone, umbrellas and light in the painting itself. It reads the picture; this page tests what is written about it.