A study against the weather record
Vincent van Gogh
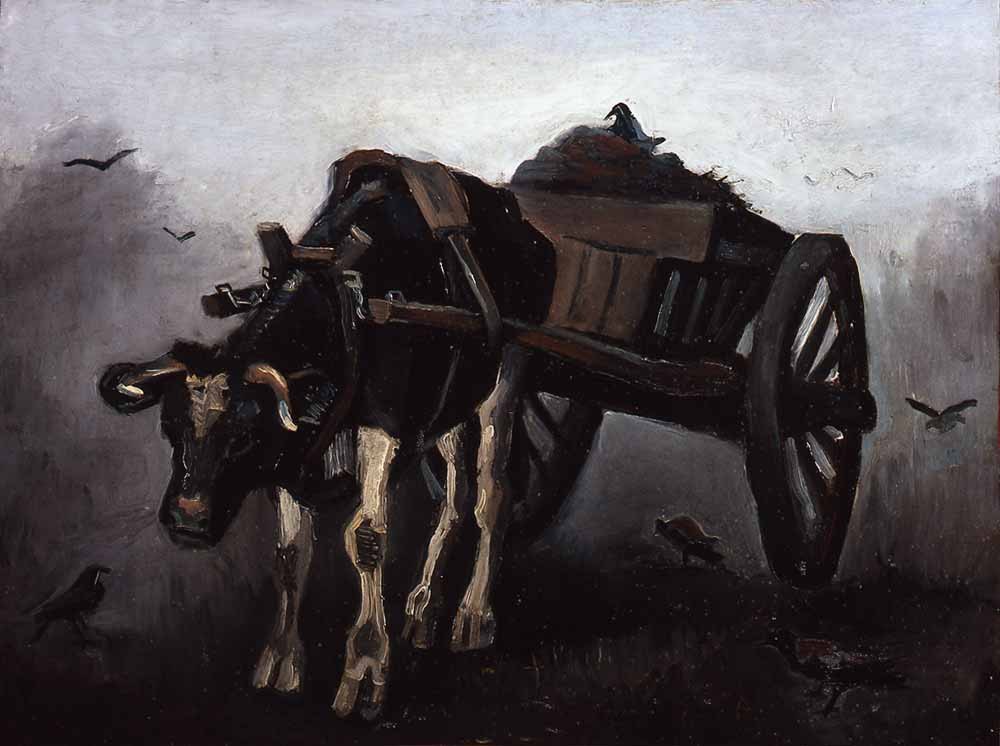
Charrette de boeuf (The Ox Cart)
Van Gogh painted his ox-carts in July 1884 and wrote that he worked early and late in the day. What was the weather at Nuenen?
“Een stoffig pad” partially agreesDay unknown
The Nephos method
How this study was read
The method in fullWhat is written
Painted at Nuenen in July 1884, between two letters to Theo; the museum gives “July, 1884” and nothing more.
’t laatst wat ik maakte zijn een paar nog al groote studies van Ossekarren, een zwarten os en een roodbonten.
Letter 452, to Theo, on or about 20 July 1884ik werk nog al veel s’morgens vroeg of s’avonds
Letter 452Door de buitengewone hitte en droogte gedurende de laatste dagen
De Zuid-Willemsvaart (Helmond), 9 July 1884
Records of those days
- Helmond rain gaugeKNMI station 896, 5 km from Nuenen, daily since 1868. Dated by the day the rain fell, as in the GHCN/ECA&D copy; KNMI’s file lists the same 1880s values two days later.
- Brussels/Saint-Josse thermometerDaily highest and lowest temperature for 1884 in the GHCN series labelled Uccle. The instrument was then at Saint-Josse-ten-Noode, Brussels; these are regional context for Nuenen.
- The Helmond newspaperDe Zuid-Willemsvaart, 9, 16 and 26 July 1884: heat and drought, lightning at Stiphout, storms on 13 and 24 July.
- RMI station historyThe 1884 readings were made at Brussels/Saint-Josse-ten-Noode, before the move to Uccle. RMI documents a relocation effect and adjustment of monthly means; comparability of this daily series across the move has not been established.
Not found or not yet searched
- No closer daily thermometer record has been keyed for this study; Utrecht and Maastricht readings exist in the newspapers.
- The KNMI Meteorologisch Jaarboek for 1884 is not online.
- The museum’s record has no description of the picture, so its sky and light are not read here.
Each claim tested
- “een stoffig pad”, the dusty path in letter 451, about 2 July. The Helmond gauge caught 6.6 mm from 20 June to 8 July 1884, the 11th driest such spell in 151 years; the 1991–2020 average is 39.9 mm.
- “buitengewone hitte en droogte”, extraordinary heat and drought, in the Helmond paper of 9 July. Brussels/Saint-Josse daily maxima for 1 to 16 July averaged 27.4 °C, while Helmond had a dry spell. No century temperature rank is reported because daily-series comparability across the later move to Uccle is unverified.
- The day the ox-cart was painted. Between about 2 and 20 July; nothing says which day, or whether it was painted outdoors.
Verdict
Van Gogh painted his ox-carts in a heat wave that broke into thunderstorms: a dry, hot fortnight at the start of July, then the storm of 13 July over Helmond. He was working early and late in the day.
- Partially agrees“een stoffig pad” One of the driest such spells on a gauge 5 km away; dust itself is not measured.
- Partially agrees“buitengewone hitte en droogte” Dry at Helmond, with high temperatures recorded in Brussels and contemporary local reports of heat; the thermometer is a regional observation.
- UnknownThe day painted The letters bound the window only to about 2 to 20 July.
What this cannot tell you. The window’s start rests on letter 451’s silence about ox-carts. Temperature comes from Brussels/Saint-Josse; rain from Helmond, 5 km away. The later Uccle location must not be used as the 1884 station location. The date correction between the two rain files is checked against two dated storms, not confirmed by KNMI. Readings that failed NOAA’s quality checks are left out. Counts of complete years describe how much data survives, not whether the station stayed comparable.
Step 2 · Records of those days
Six weeks around the ox-carts
The rain gauge at Helmond stood about 5 km from Nuenen. The nearest daily thermometer record for 1884 was kept in Brussels, at the observatory’s old site in Saint-Josse-ten-Noode. The first fortnight of July was hot and dry; from 9 July the heat broke into thunderstorms. Rain is shown on the day it fell, as in the GHCN/ECA&D copy of the KNMI series. KNMI’s own file lists every 1880s value two days later; the two files agree value for value at that offset, and two dated storms in the Helmond paper fall on the GHCN dates.
The thermometer moved from Saint-Josse to Uccle in the late 1880s, and the move changed its readings, so this study gives the 1884 heat without ranking it against later years. Readings that failed NOAA’s quality checks are left out.
- 6.6
- mm of rain at Helmond from 20 June to 8 July, the 11th driest of 151 years
- 27.4
- °C, the mean daily maximum at Brussels/Saint-Josse for 1 to 16 July; no long-record rank
- 20.0
- mm in the Helmond gauge on Sunday 13 July, the storm the paper reports
- 55.6
- mm from 2 to 20 July, against a 1991–2020 average of 44.6
Every day, rain at Helmond and temperature at Brussels/Saint-Josse
| 1884 | Rain, mm | Highest, °C | Lowest, °C |
|---|---|---|---|
| 20 June | 0.0 | 16.4 | 8.3 |
| 21 June | 0.0 | 16.3 | 9.3 |
| 22 June | 0.0 | 14.0 | 9.6 |
| 23 June | 4.4 | 16.0 | 9.2 |
| 24 June | 0.0 | 21.5 | 10.7 |
| 25 June | 0.4 | 17.8 | 11.1 |
| 26 June | 0.0 | 22.9 | 8.8 |
| 27 June | 0.0 | 25.9 | 11.7 |
| 28 June | 0.0 | 25.9 | 12.1 |
| 29 June | 0.0 | 25.9 | 9.8 |
| 30 June | 0.0 | 22.8 | 11.7 |
| 1 July | 0.0 | 25.0 | 12.0 |
| 2 July | 0.0 | 27.9 | 13.3 |
| 3 July | 0.0 | 28.6 | 13.4 |
| 4 July | 0.0 | 30.7 | 16.8 |
| 5 July | 0.8 | 29.6 | 17.1 |
| 6 July | 1.0 | 24.8 | 15.4 |
| 7 July | 0.0 | 26.3 | 14.2 |
| 8 July | 0.0 | 29.6 | 13.5 |
| 9 July | 3.2 | 30.9 | 16.9 |
| 10 July | 3.1 | 24.3 | 16.1 |
| 11 July | 1.0 | 23.2 | 12.0 |
| 12 July | 0.5 | 28.2 | 14.8 |
| 13 July | 20.0 | 30.1 | 17.2 |
| 14 July | 0.0 | 25.1 | 16.2 |
| 15 July | 3.5 | 25.5 | 16.0 |
| 16 July | 14.0 | 28.0 | 17.3 |
| 17 July | 8.5 | 18.7 | 12.8 |
| 18 July | 0.0 | 22.6 | 11.6 |
| 19 July | 0.0 | 18.8 | 10.3 |
| 20 July | 0.0 | 18.3 | 8.3 |
| 21 July | 17.0 | 21.4 | 10.1 |
| 22 July | 0.0 | 22.5 | 12.7 |
| 23 July | 6.3 | 26.7 | 14.7 |
| 24 July | 7.7 | 21.5 | 11.7 |
| 25 July | 1.0 | 17.2 | 9.7 |
| 26 July | 0.0 | 18.7 | 8.1 |
| 27 July | 5.2 | 16.9 | 10.9 |
| 28 July | 0.0 | 20.2 | 11.5 |
| 29 July | 2.4 | 17.2 | 10.8 |
| 30 July | 0.0 | 20.3 | 12.0 |
| 31 July | 0.0 | 23.9 | 11.9 |
Step 3 · The claims tested
A dry, hot start to July
Van Gogh’s letter of about 2 July describes women walking to work on een stoffig pad
, a dusty path. In the nineteen days to 8 July the Helmond gauge caught 6.6 mm, one of the driest such spells since 1869. The Helmond paper blamed buitengewone hitte en droogte
for illness among schoolchildren.
“terwijl zij op een stoffig pad van ros violet met wat groen onkruid tusschen t’koren doorgaan naar hun werk”
while they walk to their work along a dusty path of reddish violet, with some green weeds among the wheat
Letter 451, to Theo, Nuenen, on or about 2 July 1884
“Helmond. Door de buitengewone hitte en droogte gedurende de laatste dagen, komen op verseheidene plaatsen onder de schoolgaande kinderen gevallen van hersenconu’estie en andere ziektetoestanden, door inwerking der warmte veroorzaakt, voor.”
Because of the extraordinary heat and drought of the last few days, cases of brain congestion and other illnesses caused by the heat are occurring among schoolchildren in several places.
De Zuid-Willemsvaart (Helmond), 9 July 1884; Delpher OCR, errors kept
“Stiphout. Zaterdag middag sloeg de bliksem in den onden kerktoren alhier”
Stiphout. On Saturday afternoon lightning struck the old church tower here
De Zuid-Willemsvaart, 9 July 1884 (Saturday 5 July; Stiphout adjoins Nuenen)
Step 4 · Why the verdict stops at the season
Early in the morning, or in the evening
The letters bound the painting to about 2 to 20 July and say nothing of the day or whether it was painted outdoors. He describes working early and late, but does not say that heat caused that choice. The picture itself shows no datable weather, and the museum publishes no reading of its sky. The Dutch is quoted from the originals; the English beneath each quotation is Nephos’s own translation.
“’t laatst wat ik maakte zijn een paar nog al groote studies van Ossekarren, een zwarten os en een roodbonten.”
The last things I made are a pair of fairly large studies of ox-carts, a black ox and a red-and-white one.
Letter 452, to Theo, Nuenen, on or about 20 July 1884 (editors’ note markers omitted)
“ik werk nog al veel s’morgens vroeg of s’avonds en het is dan alles soms zoo onuitsprekelijk mooi.”
I work quite a lot early in the morning or in the evening, and then everything is sometimes so unspeakably beautiful.
Letter 452
“Een allerhevigst ouweder, vergezel’! van zware plasregens, hier en daar van hagelslag, en van geweldige windstoot n”
A most violent thunderstorm, with heavy downpours, hail here and there, and tremendous gusts
De Zuid-Willemsvaart, 16 July 1884, of Sunday afternoon, 13 July
Sources
Every source on this page
Each file was downloaded and given a fingerprint (its sha256). The page is rebuilt from these files and will not build if a fingerprint changes, so every number above comes from them rather than being typed in.
- Helmond daily rain, GHCN-Daily NLE00102079 (from ECA&D, after KNMI)
sha256 897cb55f854f3be848d8441f2683cecb4352242fa371e5e7449c8347be2de53a - KNMI daily rain, Helmond station 896, 1868–2026
sha256 9b79f65d567376380292a01d684fa45dbc373b0d4f851fef221fc1537e76579b - Brussels/Saint-Josse daily temperature in 1884, carried in GHCN-Daily BE000006447 (Uccle series)
sha256 3a1519afa1ed6c6f0c801da6a355109eafb19c21ce3754ce4c11f5f128478918 - Royal Meteorological Institute of Belgium, temperature trends at Uccle and the move from Sint-Joost-ten-Node
sha256 9b904f718a54140c7e2f850f360be994b54a16f3e66de36abdf757fb3a936041 - Vincent van Gogh, letter 451 to Theo, Van Gogh Museum and Huygens ING edition
sha256 4e39865f45e97c46cc541969593f7d480de986e4da9a9d0f09bf00312bd7fc06 - Vincent van Gogh, letter 452 to Theo, Van Gogh Museum and Huygens ING edition
sha256 aa305425055fef5cf0effb76818362f92d67b62be9ed13c40f1c58fe91b0bb35 - Portland Art Museum, Charrette de boeuf (The Ox Cart), 2007.68, collection record
sha256 3c0834360b8440c0e9f80fe447603d3c11c926a1ee6db97c9258259e3d8717c1 - De Zuid-Willemsvaart, 9 July 1884 (Delpher)
sha256 223f0f8158ac59ad09c0d92b63596b17c25dccc22045e0ad6de5f7c6fdd5c633 - De Zuid-Willemsvaart, 16 July 1884 (Delpher)
sha256 f57d5099e615a73e8062bf92d45d7b4aeecfa4a3f8dd4f65444998e56bf4ac6f - De Zuid-Willemsvaart, 26 July 1884 (Delpher)
sha256 39bac7ef4445f68fdc67cf5c526b991f4221305ca9db64bfb1b1a744cbe1daaf