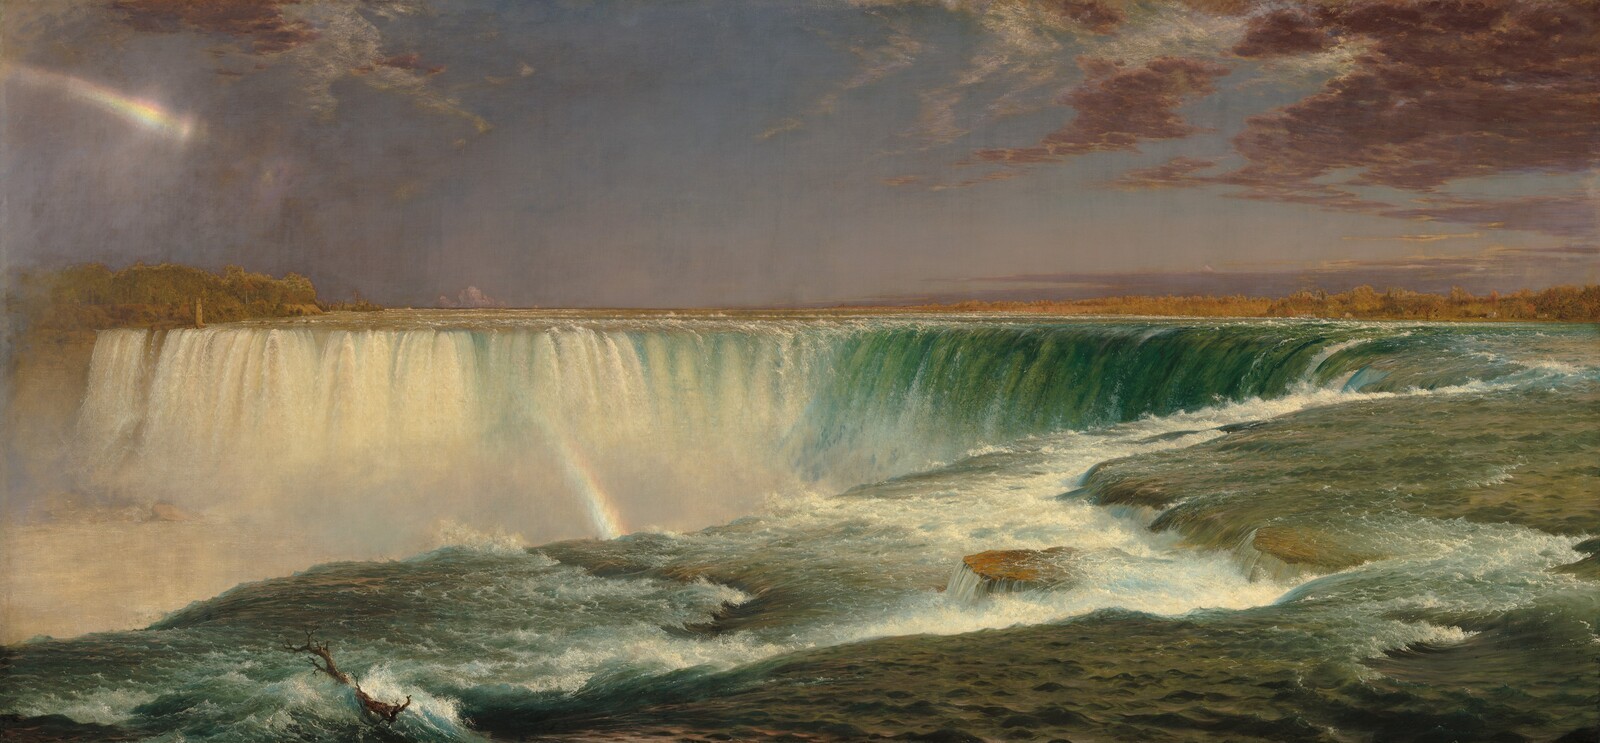
A study against the weather record
Frederic Edwin Church
Niagara
A rainbow makes the falls look immediate. Can the records make this a single weather moment?
Visit-month contextPainted weather unknown
The Nephos method
How this study was read
The method in fullWhat is written
The NGA catalogue dates field visits to four months of 1856 and describes a Canadian-side composition assembled from several viewpoints in the studio. The canvas is dated 1857; no painted weather day is established.
His first trip was in March 1856
Franklin Kelly, Corcoran catalogue (2011), p. 112He was back in July and then in September and October
Franklin Kelly, Corcoran catalogue (2011), p. 112
Records of those days
- ECCC TORONTO, Climate ID 615835070.9 km from the falls reference. 123 daily entries in the four visit-month envelopes; each month remains separate.
- Computed sun and rainbow coneApproximate NOAA solar positions and NWS primary-bow radius. Illustrative solar hours, not weather observations or a fit to the canvas.
Not found or not yet searched
- Fort Niagara is closer (20.5 km), but all its visit-month measurement fields are blank.
- Exact visit days and a unique compass-calibrated viewpoint remain unestablished. The original artist letters, a dated sketch inscription and original exhibition-review scans were not verified.
- No local weather witness, sunshine series or river discharge record has been established. The Toronto archive’s exact historical instrument and site continuity are not reconstructed.
Each claim tested
- Does the canvas preserve the weather of one field visit? Unknown. Multiple visits and a composite studio view are documented; the monthly envelopes cannot identify a painted day.
- Does the rainbow establish that rain fell? No. A sunlit spray bow requires droplets and illumination; a rainfall total at Toronto cannot establish either at Niagara.
- Can geometry date the rainbow? No. Computed cone orientations show how solar height changes the bow; the painted viewpoint and angular scale are not calibrated.
Verdict
A carefully constructed view can look immediate without preserving a single weather moment. Regional daily records give the documented visit months a setting; local light, spray and flow remain unresolved.
- Partially agreesRegional context for the documented visits Daily station data survive for the four named months; dates of presence within them remain unknown.
- UnknownWeather and rainbow in the finished canvas Neither the regional records nor illustrative geometry establish an observed sky or a dated rainbow.
What this cannot tell you. Separate whole-month arithmetic means of ECCC daily mean temperatures; separate sums of daily liquid rainfall (mm) and snowfall (cm). No averaging between stations or across visit months. Blank flag plus a finite numerical value is accepted; T is retained as a trace encoded as zero for precipitation sums. Missing or other flags become null with a reason. A monthly value needs every calendar date and accepted component. A total with traces is the sum of measurable amounts, with unquantified trace amounts additional; T does not mean no precipitation. Snowfall centimetres are not millimetres of rain or snow depth on the ground. One-year regional context, no historical rank, modern normal or anomaly. Historical instrument/exposure and observing-day changes are not homogenized. No local sunshine, cloud register, discharge or artist-session link has been established. No unique Canadian-side viewpoint, compass calibration, angular scale or spray elevation is established for the composite painting. These positions describe possible cone orientations at the falls, not proof that a cone intersects the painted spray. A negative top elevation places the entire bow below the astronomical horizon; spray below eye level can still intercept it. No weather, sunlight occurrence, rainbow sighting or painted hour is inferred.
Step 1 · The picture and its making
Several visits, one convincing view
The National Gallery of Art identifies Niagara as an 1857 oil on canvas, accession 2014.79.10, from the Corcoran Collection. The object record describes a broken rainbow in the mist. That detail can invite a weather question, but the picture’s making gives a reason to resist a single-day answer.
In Franklin Kelly’s catalogue account, Church visited in March, July, September and October 1856. The winter encounter produced snow-and-ice studies; the finished view across Horseshoe Falls from the Canadian side combines details from different positions. Church developed the composition in his New York studio. The NGA’s account dates its New York exhibition opening to 1 May 1857.
The weather windows below are the four whole visit months. They include days when Church may have been elsewhere. Neither a continuous stay nor a day for the painted sky is claimed. Cooper Hewitt also cautions that the winter oil sketch it discusses may itself be a studio distillation.
“His first trip was in March 1856”
Franklin Kelly, catalogue entry, p. 112
“He was back in July and then in September and October”
Franklin Kelly, catalogue entry, p. 112
Step 2 · Daily records, regional scale
Winter, summer and autumn at Toronto
The ECCC TORONTO archive, Climate ID 6158350, supplies 123 daily entries in these months. Its published coordinates put it about 70.9 km from the Horseshoe Falls reference, across Lake Ontario. These are Toronto measurements, with no claim that Niagara shared each day’s conditions.
March’s mean of daily mean temperatures is −5.7 °C, with 41.0 cm of measured snowfall plus a trace. July’s corresponding temperature mean is 21.0 °C. This gives the winter and summer visits different regional settings. It cannot establish snow cover at the falls, identify a sketching day or decide which visit supplied the painted light.
| Month | Mean · °C | Rain · mm | Rain trace days | Snowfall · cm | Snow trace days | Daily entries |
|---|---|---|---|---|---|---|
| March | −5.7 | 0.0 | 0 | 41.0 | 1 | 31 |
| July | 21.0 | 29.2 | 1 | 0.0 | 0 | 31 |
| September | 13.5 | 105.2 | 1 | 0.0 | 0 | 30 |
| October | 7.1 | 22.9 | 2 | 0.3 | 1 | 31 |
Temperature is the arithmetic mean of the archive’s daily mean field. Precipitation totals sum daily measurable amounts; unquantified traces remain additional. Snowfall is newly fallen snow, not snow depth on the ground. Blank flags and trace flags are retained; missing or unsupported entries would become unknown and prevent a complete-month aggregate. No historical rank or modern anomaly is needed for this question. ECCC definitions.
A nearer record runs out. The modern Fort Niagara reference lies 20.5 km from the falls. Its daily archive has date rows for the visit months but every measurement field is blank. The archive’s positive longitude magnitude is retained in the download; the distance uses a separate modern fort reference. The nominal coverage dates do not establish usable observations.
Read every daily entry used
| Date | Daily mean · °C | Rain · mm | Snowfall · cm |
|---|---|---|---|
| 1 March | −4.5 | 0.0 | 11.4 |
| 2 March | −6.4 | 0.0 | 0.8 |
| 3 March | −8.6 | 0.0 | 8.6 |
| 4 March | −5.3 | 0.0 | 1.0 |
| 5 March | −6.4 | 0.0 | 0.5 |
| 6 March | −10.3 | 0.0 | 0.0 |
| 7 March | −11.9 | 0.0 | 4.8 |
| 8 March | −18.7 | 0.0 | 0.0 |
| 9 March | −19.8 | 0.0 | 0.0 |
| 10 March | −15.6 | 0.0 | 0.0 |
| 11 March | −9.2 | 0.0 | 0.0 |
| 12 March | −7.8 | 0.0 | 0.0 |
| 13 March | −5.6 | 0.0 | 0.0 |
| 14 March | −4.4 | 0.0 | 0.5 |
| 15 March | −2.5 | 0.0 | 0.0 |
| 16 March | −2.8 | 0.0 | 0.0 |
| 17 March | −2.5 | 0.0 | 0.0 |
| 18 March | −0.3 | 0.0 | 0.0 |
| 19 March | −2.2 | 0.0 | Trace |
| 20 March | −0.9 | 0.0 | 0.0 |
| 21 March | 0.9 | 0.0 | 0.0 |
| 22 March | −2.0 | 0.0 | 0.0 |
| 23 March | −2.0 | 0.0 | 2.5 |
| 24 March | 0.6 | 0.0 | 9.1 |
| 25 March | 1.1 | 0.0 | 0.0 |
| 26 March | −0.6 | 0.0 | 0.0 |
| 27 March | −5.6 | 0.0 | 1.3 |
| 28 March | −6.9 | 0.0 | 0.5 |
| 29 March | −5.3 | 0.0 | 0.0 |
| 30 March | −5.9 | 0.0 | 0.0 |
| 31 March | −6.1 | 0.0 | 0.0 |
| 1 July | 15.0 | 0.0 | 0.0 |
| 2 July | 16.1 | 0.0 | 0.0 |
| 3 July | 23.1 | 0.0 | 0.0 |
| 4 July | 16.7 | 0.0 | 0.0 |
| 5 July | 19.7 | 9.7 | 0.0 |
| 6 July | 15.9 | 0.0 | 0.0 |
| 7 July | 14.2 | 0.0 | 0.0 |
| 8 July | 17.8 | 0.0 | 0.0 |
| 9 July | 18.1 | 0.0 | 0.0 |
| 10 July | 19.7 | 0.0 | 0.0 |
| 11 July | 21.4 | 0.0 | 0.0 |
| 12 July | 20.3 | Trace | 0.0 |
| 13 July | 21.7 | 0.0 | 0.0 |
| 14 July | 24.2 | 10.4 | 0.0 |
| 15 July | 21.9 | 0.0 | 0.0 |
| 16 July | 23.6 | 0.0 | 0.0 |
| 17 July | 28.6 | 0.0 | 0.0 |
| 18 July | 21.7 | 0.0 | 0.0 |
| 19 July | 18.9 | 0.0 | 0.0 |
| 20 July | 19.5 | 0.0 | 0.0 |
| 21 July | 18.9 | 2.0 | 0.0 |
| 22 July | 20.9 | 0.0 | 0.0 |
| 23 July | 22.5 | 3.0 | 0.0 |
| 24 July | 24.5 | 0.0 | 0.0 |
| 25 July | 24.5 | 0.0 | 0.0 |
| 26 July | 26.1 | 0.0 | 0.0 |
| 27 July | 25.3 | 2.3 | 0.0 |
| 28 July | 25.0 | 1.3 | 0.0 |
| 29 July | 22.0 | 0.5 | 0.0 |
| 30 July | 22.0 | 0.0 | 0.0 |
| 31 July | 20.3 | 0.0 | 0.0 |
| 1 September | 11.4 | 0.0 | 0.0 |
| 2 September | 14.7 | 0.0 | 0.0 |
| 3 September | 14.2 | 0.0 | 0.0 |
| 4 September | 17.0 | 0.0 | 0.0 |
| 5 September | 17.0 | 6.1 | 0.0 |
| 6 September | 20.0 | 0.0 | 0.0 |
| 7 September | 15.0 | 13.0 | 0.0 |
| 8 September | 18.4 | 0.0 | 0.0 |
| 9 September | 18.3 | 0.0 | 0.0 |
| 10 September | 21.7 | 18.5 | 0.0 |
| 11 September | 15.0 | 0.0 | 0.0 |
| 12 September | 13.1 | 5.8 | 0.0 |
| 13 September | 13.9 | 0.5 | 0.0 |
| 14 September | 13.7 | 0.0 | 0.0 |
| 15 September | 17.2 | 0.0 | 0.0 |
| 16 September | 13.6 | 0.0 | 0.0 |
| 17 September | 17.0 | 16.3 | 0.0 |
| 18 September | 17.8 | 1.3 | 0.0 |
| 19 September | 12.0 | 0.0 | 0.0 |
| 20 September | 10.0 | 0.0 | 0.0 |
| 21 September | 8.4 | 0.5 | 0.0 |
| 22 September | 7.8 | 0.0 | 0.0 |
| 23 September | 8.3 | 0.0 | 0.0 |
| 24 September | 7.3 | 0.5 | 0.0 |
| 25 September | 9.2 | Trace | 0.0 |
| 26 September | 11.9 | 0.0 | 0.0 |
| 27 September | 10.6 | 0.0 | 0.0 |
| 28 September | 13.1 | 0.5 | 0.0 |
| 29 September | 8.9 | 30.5 | 0.0 |
| 30 September | 7.5 | 11.7 | 0.0 |
| 1 October | 7.5 | 0.0 | 0.0 |
| 2 October | 7.8 | 0.0 | 0.0 |
| 3 October | 9.2 | 0.0 | 0.0 |
| 4 October | 9.7 | 0.0 | 0.0 |
| 5 October | 11.4 | Trace | 0.0 |
| 6 October | 10.6 | 0.0 | 0.0 |
| 7 October | 7.3 | 0.0 | 0.0 |
| 8 October | 9.5 | 0.0 | 0.0 |
| 9 October | 13.9 | 0.0 | 0.0 |
| 10 October | 13.7 | 0.0 | 0.0 |
| 11 October | 13.1 | 0.0 | 0.0 |
| 12 October | 10.3 | 3.0 | 0.0 |
| 13 October | 7.5 | Trace | 0.0 |
| 14 October | 0.9 | 0.0 | 0.0 |
| 15 October | 2.3 | 0.0 | 0.0 |
| 16 October | 3.1 | 0.0 | 0.0 |
| 17 October | 7.2 | 9.4 | 0.0 |
| 18 October | 7.5 | 5.8 | 0.0 |
| 19 October | 7.0 | 0.3 | 0.0 |
| 20 October | 7.5 | 0.0 | 0.0 |
| 21 October | 7.3 | 0.0 | 0.0 |
| 22 October | 11.1 | 0.8 | 0.0 |
| 23 October | 1.4 | 0.0 | 0.0 |
| 24 October | −0.3 | 0.0 | 0.0 |
| 25 October | 3.9 | 0.3 | 0.0 |
| 26 October | 6.7 | 0.0 | 0.0 |
| 27 October | 5.6 | 2.8 | 0.0 |
| 28 October | 5.0 | 0.0 | 0.0 |
| 29 October | 7.3 | 0.5 | 0.0 |
| 30 October | 2.2 | 0.0 | Trace |
| 31 October | 1.7 | 0.0 | 0.3 |
Step 3 · A computed geometry check
A spray bow is not a rain gauge
The National Weather Service explanation relates a primary rainbow to sunlight and droplets, with an approximate angular radius of 42° around the point opposite the sun. In a waterfall’s spray, droplets need not come from falling rain. That is an optical explanation, not evidence that a rainbow was seen during Church’s visits.
The table calculates possible sunlight directions at the falls reference using NOAA’s approximate equations. Each mid-month scenario date is chosen solely to illustrate geometry; none is asserted to be a day Church was there. Hours are apparent solar time, with noon when the sun crosses the local meridian, not an 1856 civil clock.
For example, computed solar noon on 15 July puts the sun 68.5° above the horizon and the bow’s highest point 26.5° below it. A bow could then occur only in droplets below eye level, if illuminated spray occupies the required directions. At 15:00 solar time on 15 October, the computed sun is 24.4° high and the bow’s top 17.6° above the horizon. This contrast shows why an elevated view into spray needs more care than a rule about rainbows against the sky.
Computed sun positions and bow geometry
| Scenario date | Solar hour | Sun height · ° | Sun bearing · ° | Bow centre bearing · ° | Bow top · ° |
|---|---|---|---|---|---|
| 15 March | 09:00 | 29.4 | 125.8 | 305.8 | 12.6 |
| 15 March | 12:00 | 44.8 | 180.0 | 0.0 | −2.8 |
| 15 March | 15:00 | 29.4 | 234.2 | 54.2 | 12.6 |
| 15 July | 09:00 | 47.0 | 105.3 | 285.3 | −5.0 |
| 15 July | 12:00 | 68.5 | 180.0 | 0.0 | −26.5 |
| 15 July | 15:00 | 47.0 | 254.7 | 74.7 | −5.0 |
| 15 September | 09:00 | 33.7 | 122.0 | 302.0 | 8.3 |
| 15 September | 12:00 | 50.2 | 180.0 | 0.0 | −8.2 |
| 15 September | 15:00 | 33.7 | 238.0 | 58.0 | 8.3 |
| 15 October | 09:00 | 24.4 | 129.8 | 309.8 | 17.6 |
| 15 October | 12:00 | 38.6 | 180.0 | 0.0 | 3.4 |
| 15 October | 15:00 | 24.4 | 230.2 | 50.2 | 17.6 |
The viewpoint remains a limit. The Canadian side is documented, but the canvas joins several views. No unique observer point, compass bearing, angular scale or spray elevation has been established. These calculations do not show that a cone intersects the painted spray, validate the arc’s perspective or identify an hour, season or recent shower. They are computed possibilities, not recovered observations.
Step 4 · What the comparison can carry
Immediacy without a single weather moment
The museum’s account establishes a constructed viewpoint; the daily archive establishes regional conditions during the months of documented visits. Together they support a classroom distinction between close study of nature and a picture that records one moment. The catalogue’s account of winter fieldwork does not oblige the studio canvas to preserve winter.
The painting’s rainbow is consistent with a physical mechanism involving sunlit spray, but this study cannot establish an observed rainbow, the truth of the painted sky or the falls’ flow. A Toronto rainfall total supplies none of those missing links. Local sunshine and cloud observations, dated sketches and a defensible reconstruction of the viewing geometry would make a stronger test possible.
The NGA connects Niagara to tourism, national symbolism and the spectacle of its paid exhibition. Those histories can be discussed alongside the choice to make a composite view look immediate. A successful illusion and a weather measurement answer different questions.
Sources
Every source on this page
Weather values and geometry inputs come from cached files checked against sha256 fingerprints. The museum and image-policy receipts identify saved web-tool text; the catalogue-text receipt is a PDF extraction. Quoted date phrases are checked against that extraction. A fingerprint preserves the evidence used; it does not independently validate its interpretation.
- Franklin Kelly, Niagara, Corcoran Gallery of Art: American Paintings to 1945 (2011)
sha256 b851d1bbd1fafdcdbed370edb2a3b209a92f96c1a70e32e85c254ff44f1a961e - Text extraction of Kelly’s catalogue entry
sha256 25b936c026f52b5c24926d0b2a11edad9fc1829354e96830b5ad617f3972f739 - NGA, Niagara, 2014.79.10
sha256 76fce90b12bf9f34b683fc009875220184a7fabccb979f6d168166e5aecc6866 - NGA, The 19th-Century Blockbuster (4 August 2023)
sha256 2d68c8ec48c6c989067c5b3eced4ccbfe8c8dd07c4d7558b95f3bcdffe6e2dc2 - NGA Open Access Policy
sha256 2d68c8ec48c6c989067c5b3eced4ccbfe8c8dd07c4d7558b95f3bcdffe6e2dc2 - Frederic Edwin Church, Niagara (1857), NGA 2014.79.10
sha256 271537d1f6ba1fbd0f09704ddc0305071693e3a5ba671e5d78e657113df32ccd - ECCC, TORONTO daily data, Climate ID 6158350, 1856
sha256 86d6b4ed2d6bee69c21362b4496301f12d00aa132c4368625f0f1775ebde5fca - ECCC climate glossary
sha256 3e118ab11894d210d2ffbfa1c7d3cf065623b4c0ec8a76b796582130b644399a - Open Government Licence – Canada
sha256 d7648d6d694d66a0891502f85c3383f9263d5e541b47e14fbf33450974af158f - Fort Niagara, NOAA/CDMP daily archive, keyed and checked by MRCC
sha256 332f1a5dd49cc6e8b1ea9abaed4af4bacdffb87894f10f652237ece6c63fe81b - MRCC, Fort Niagara metadata and file-format notes
sha256 0abe835fcf10ed0a8431bc1dea028ad83d5f11f52a68fce713b4ec6d32107c55 - OpenStreetMap, Horseshoe Falls, way 56539663
sha256 48b48fdc11078adf97c67c241dab4be3b8c9bfee9dc83f7f577795cbcec7903f - NOAA, General Solar Position Calculations
sha256 7fa1fdb5f6b5c05ab1ec3ffde92e6fb2d5df98bf1a87055075ae2c3c1240a627 - NWS Flagstaff, How Do Rainbows Form?
sha256 04ab078c161aaf641d7d785e4f382f113798addf3f8b1bc233a1af96c5c4fed6 - Cooper Hewitt, Alchemy In Situ (11 March 2013)
sha256 8b809ecf899b7437648331ded7f27add03a558625f62a63665850eb7729e0de8 - OpenStreetMap, Old Fort Niagara, way 137364896
sha256 2b43820725c836d715209777d53bad04551913c4a92765b54a188057bce277f1
