A study against the weather record
August F. Biehle Jr.
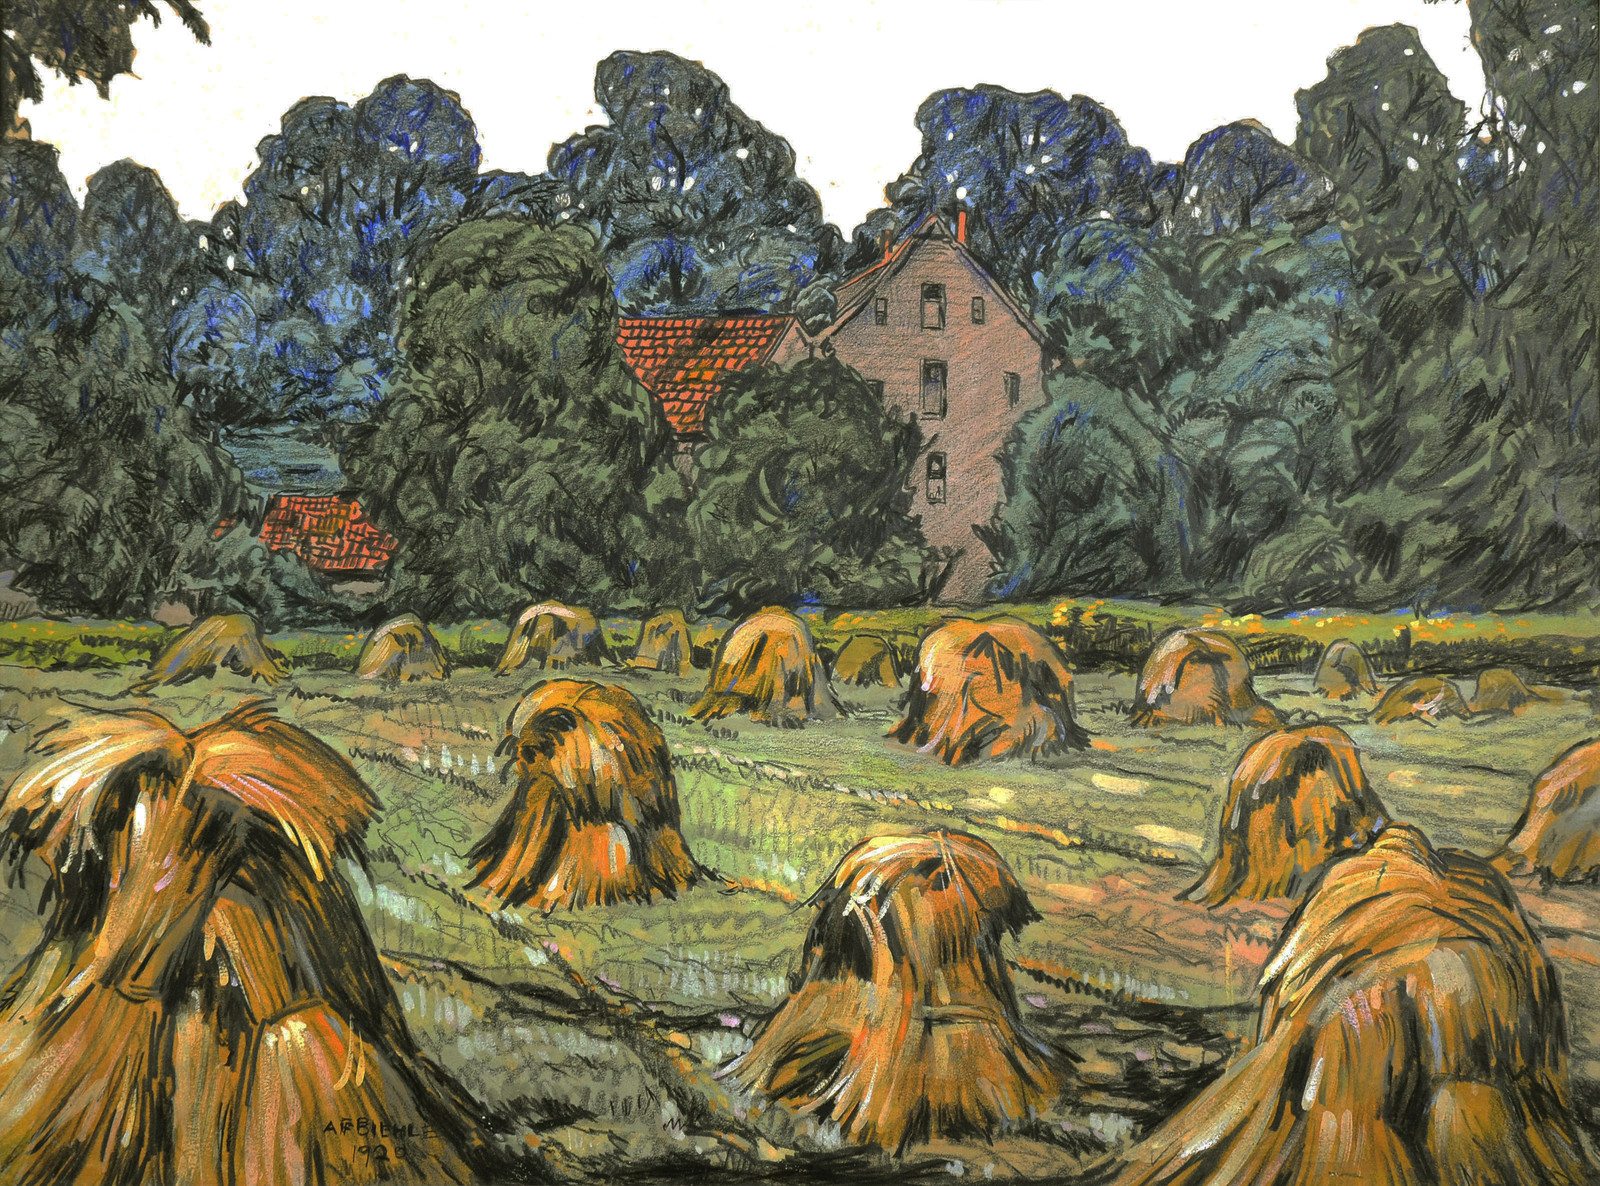
Wheatfield in Zoar
Wheat cut and stood in shocks: a fair-looking moment in a harvest repeatedly interrupted by rain.
Regional harvest rain-interruptedPainted day unknown
The Nephos method
How this study was read
The method in fullWhat is written
Nephos’s reading of the picture, not a museum statement: cut wheat stands in shocks across stubble, with leafy trees, a house and red roofs behind a fair-looking field. It suggests the days after cutting, while shocks dried. The catalogue establishes 1920; the depicted harvest stage does not date a painting session.
Wheatfield in Zoar
Canton Museum of Art, accession 86.18; date field: 1920Harvest progressed northward during the week to the southern portions of Nebraska and Iowa and central Ohio.
USDA, week ending 6 July 1920; Chronicle, 10 July, p. 206
Records of those days
- Four contemporary harvest reportsWeeks ending 6, 13, 20 and 27 July: harvest reaches central Ohio, rain delays work, and harvest approaches completion across the central/eastern belt. Regional reports, not a Zoar farm diary.
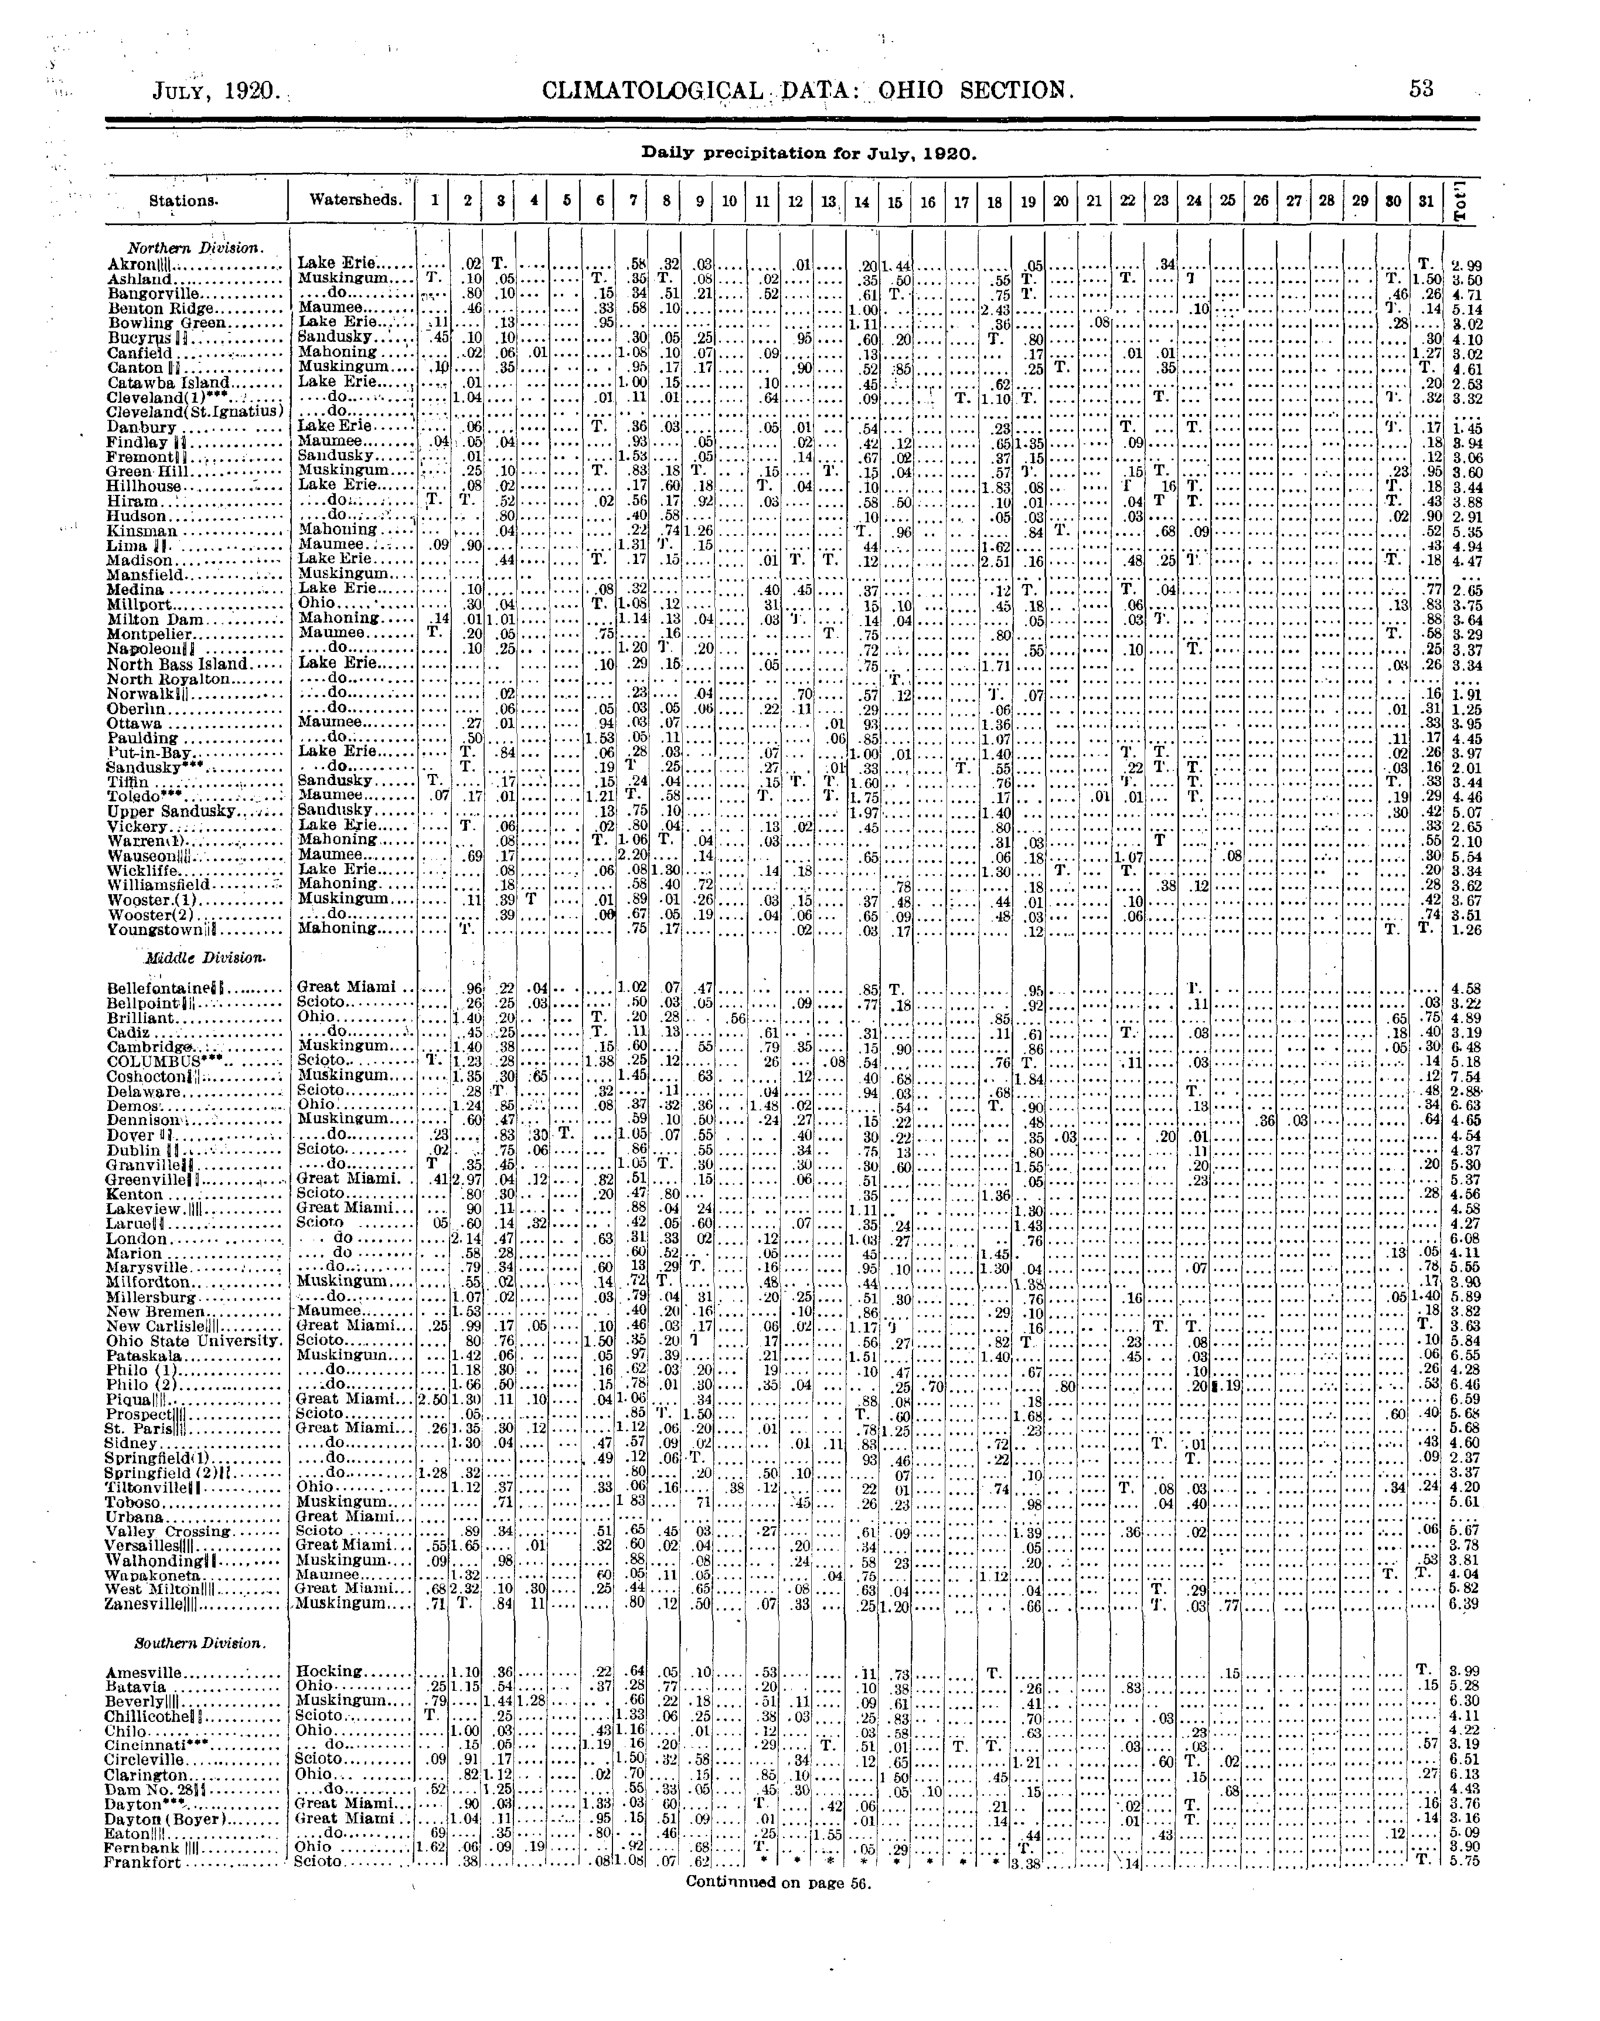
- Dover’s daily rain and monthly summaryGeorge E. Fertig’s printed July 1920 record, checked against NOAA’s digitized copy. Morning readings cover the preceding 24 hours; dotted cells stay unassigned.
- Modern July comparisonsNew Philadelphia’s 1991–2020 July normal and Ohio’s 2020 crop progress. Separate places, periods and measures; no merged station series or trend.
Not found or not yet searched
- The exact field, cutting date, painted day and outdoor/studio sequence are unestablished.
- No verified county cutting date, Zoar-field eyewitness or artist weather letter was found in the accessed sources; archival absence is not claimed.
- No open licence for the painting image was established; the museum image is linked.
Each claim tested
- Did rain interrupt the regional wheat-harvest period? Yes. USDA reports describe delays; Dover has 8 measurable entries totalling 2.97 inches (75.4 mm) in the 14 printed dates from 7–20 July. This tests repeated nearby wetting, not the moisture of the painted shocks.
- Does fair-looking weather conflict with that sequence? No conflict is established. A fair-looking moment can sit within a rain-interrupted season. The records do not verify the painted sky or supply its date.
- How does the season compare with modern records? Dover’s published July total is 4.54 inches; New Philadelphia’s separate modern July normal is 3.90 inches, based on 13 available years with NOAA estimates for missing months. Ohio had harvested 51% of winter wheat by 5 July 2020, against a 2015–2019 average of 41%. These are seasonal comparisons, not climate trends.
- Can the records say which weather Biehle changed? No dated preparatory state or field observation supports that claim. The arrangement of shocks, trees and roofs is discussed as Nephos’s visual interpretation.
Verdict
Nephos reads cut wheat standing in shocks to dry. Contemporary reports place the regional harvest in July; Dover recorded 8 measurable rain entries totalling 2.97 inches during 7–20 July. The fair-looking scene fits a rain-interrupted harvest, without identifying its day.
- Partially agreesRegional harvest interrupted by rain Contemporary reports and repeated nearby gauge amounts support this seasonal finding.
- UnknownPainted day and weather at the field Neither the crop-report geography nor Dover’s gauge resolves the particular scene.
What this cannot tell you. Dover is nearby, not the pictured field. Blank rain amounts are not measured dry days; clear-day and rain-day counts overlap. New Philadelphia’s normal is representative (R), with NOAA estimates from surrounding stations. Historical cutting progress and modern harvested percentages cannot measure a shift in harvest date.
Step 1 · Read the picture
The wheat is cut. The work is not over.
Nephos’s reading of the picture, not a museum statement: Wheat cut and stood in shocks across a stubble field, fully leafed trees, a house and red roofs behind, a fair-looking sky: the days just after the wheat harvest, when shocks stood drying in the field.
The golden stalks stand in separate upright bundles across a low, cut field. Dense foliage fills the background around the house and roofs. The small visible sky is pale and open, and the field is lit; no falling rain is depicted. Together these features suggest a harvest recently cut and left standing to dry. They identify a stage of work, not the number of days since cutting. Look at the museum image.

That reading makes a specific question possible: did the regional wheat harvest have a rain-free drying interval, or did rain repeatedly interrupt it? Contemporary crop reports supply the seasonal sequence; the nearby Dover gauge supplies the daily rainfall test. Canton’s catalogue supplies the year, 1920. No document yet ties this watercolor to a day, month or particular field. Canton’s object record, 86.18.
Step 2 · Test the drying interval
A harvest repeatedly interrupted by rain
The USDA reported harvest reaching central Ohio by the week ending 6 July. The next two reports describe rain interrupting work in Ohio and the upper Ohio Valley. By 27 July the harvest was nearing completion across the central and eastern wheat belt. These are regional milestones, not dates when a particular Zoar farm cut or shocked its wheat.
The test result: repeated rain at Dover supports the reports of interrupted regional harvest work. The 8 measured falls during 7–20 July total 65.4% of its published July rainfall. A fair-looking harvest scene can belong to a season in which drying was repeatedly interrupted. This does not establish whether these particular shocks were rained on, or how long they took to dry.
“Harvest progressed northward during the week to the southern portions of Nebraska and Iowa and central Ohio.”
Week ending 6 July. USDA, reprinted 10 July 1920, p. 206. Report scope: central Ohio within a national summary.
“considerable interruption by rain in some Eastern sections, especially in Ohio and West Virginia.”
Week ending 13 July. USDA, reprinted 17 July 1920, p. 309. Report scope: Ohio and West Virginia.
“Frequent rains delayed harvesting and threshing in the northern and upper Ohio Valley and Central Atlantic coast districts.”
Week ending 20 July. USDA, reprinted 24 July 1920, p. 407. Report scope: northern and upper Ohio Valley and Central Atlantic coast districts.
“The harvesting of winter wheat is nearing completion in central and eastern parts of the belt”
Week ending 27 July. USDA, reprinted 31 July 1920, p. 512. Report scope: central and eastern winter-wheat belt.
These contemporary witnesses are successive government reports, preserved in the Commercial and Financial Chronicle. The newspaper reprints are not independent confirmation of the USDA reports. No verified Zoar-field eyewitness, county cutting date or artist’s weather letter was found in the sources accessed. That is a search limit, not a claim that none survives.
Every printed day in the Dover rainfall row
| Morning reading | Precipitation, inches |
|---|---|
| 1 July | 0.23 |
| 2 July | No amount printed |
| 3 July | 0.83 |
| 4 July | 0.30 |
| 5 July | Trace, less than 0.01 |
| 6 July | No amount printed |
| 7 July | 1.05 |
| 8 July | 0.07 |
| 9 July | 0.55 |
| 10 July | No amount printed |
| 11 July | No amount printed |
| 12 July | 0.40 |
| 13 July | No amount printed |
| 14 July | 0.30 |
| 15 July | 0.22 |
| 16 July | No amount printed |
| 17 July | No amount printed |
| 18 July | No amount printed |
| 19 July | 0.35 |
| 20 July | 0.03 |
| 21 July | No amount printed |
| 22 July | No amount printed |
| 23 July | 0.20 |
| 24 July | 0.01 |
| 25 July | No amount printed |
| 26 July | No amount printed |
| 27 July | No amount printed |
| 28 July | No amount printed |
| 29 July | No amount printed |
| 30 July | No amount printed |
| 31 July | No amount printed |
Step 3 · Then and now
July still belongs to the wheat harvest
The modern records offer two useful comparisons: how much rain a nearby July receives, and how far wheat harvesting has progressed by early July. Neither comparison identifies the painted day.
| Record | July precipitation | What it represents |
|---|---|---|
| Dover, 1920 | 4.54 in / 115.3 mm | Published monthly total at the historical station. |
| New Philadelphia, 1991–2020 | 3.90 in / 99.1 mm | NOAA representative July normal; 13 years of available data, with missing months estimated. |
New Philadelphia’s catalogue position is 14.1 km from Zoar. Its normal is flagged R: NOAA fills missing months using surrounding stations. The two totals are of a similar scale, but they belong to different places and periods. They cannot show a century-long rainfall trend or rank the historical month. NOAA July normal · Coverage and estimation rules.
| Period | What was reported |
|---|---|
| Week ending 6 July 1920 | Harvest had reached central Ohio. |
| Week ending 5 July 2020 | 51% of Ohio winter wheat harvested; the 2015–2019 average was 41%. |
A century later, early July was still an active wheat-harvest period in Ohio. The modern report attributes that week’s rapid progress to warm, dry weather. But a statewide percentage of wheat harvested is not the same measure as the northward advance of cutting, or the number of days that bundles stood drying. These sources support a seasonal comparison, not a calculation of how many days the harvest has shifted. USDA NASS, 6 July 2020, p. 1.
Step 4 · Return to the watercolor
The waiting crop carries the weather story
In Nephos’s reading, Biehle makes the shocks the foreground subject: large golden bundles close to us, repeated smaller forms leading back toward the house, and only a narrow opening of sky above the trees. The stage of farm work makes weather matter even though little sky is shown.
Canton’s account of Biehle’s style emphasizes “rich, evocative colors and expressive shapes.” Sackerlotzky’s discussion of the Zoar group describes his interest in the village’s fields, gardens and red-roofed houses. Those sources help explain his selection and arrangement of a rural subject. They do not establish that he changed this sky. Museum biography · Zoar study.
What the comparison adds: the shocks identify a weather-dependent pause in farm work. The reports and gauge show a regional harvest repeatedly interrupted by rain. The painting’s fair-looking moment remains plausible within that unsettled sequence; no claim of a false sky, an exact date or a reconstructed drying time follows.
Limits, station coverage and the original weather page
Dover’s catalogue position is 10.4 km from Zoar. The printed table names George E. Fertig as observer. The precise instrument site and painted field remain unlocated. A morning amount covers the preceding 24 hours, not the whole calendar day written beside it. Rainfall alone also does not give the humidity, wind or moisture inside a wheat shock.
For the full month, Dover lists 13 measurable rain entries, 1 trace and 17 dotted cells with no amount printed. The numerical entries reconcile with the published 4.54 inches. The observer also classified 19 days as clear, 0 as partly cloudy and 12 as cloudy. These classes have no daily assignments here, and a clear day can include rain. Dotted rainfall cells are missing in NOAA’s digitized Dover file; none is converted to a measured zero.
The nearby Dennison record is retained separately, with presumed-zero entries flagged. It does not fill Dover’s gaps. No temperature inference is published because the printed and digitized temperature sequences need reconciliation. The original Dover station does not extend into the modern normal period. No dated preparatory state, painting session or object-specific outdoor/studio sequence has been established.
Sources
Every source on this page
Each file was downloaded and given a fingerprint (its sha256). The page is rebuilt from these files and will not build if a fingerprint changes, so every number above comes from them rather than being typed in.
- Canton Museum of Art, Wheatfield in Zoar, accession 86.18
sha256 f05c24add3165c9d512c1b76d4e7b8a29c17e7cc0141d82b7e70c5d89e6991f1 - Canton Museum of Art, August F. Biehle Jr. biography
sha256 9a937c0d94e42dd54c84e832c87fca290ff4b55e8e58e6cf1798411ddfc6d0f2 - Canton Museum of Art, Rights and Reproductions
sha256 4928ad193394f780806c74801186801280e4ea5310689f037183b0f3feffec11 - Canton Museum of Art, Winter 2024–25 magazine
sha256 4b81f835e070c63214ae00151b45ffcde3ada2a98b3180f9503c0f65ccaadef4 - Rotraud Sackerlotzky, Ohio Landscapes, excerpt on the artist website
sha256 3138fd3c2cfe268ca781c8191b2748f434226cd582371b3c8900be0dbd1a9f38 - August Biehle website, exhibition chronology
sha256 81915217afec55e025d970d471d2ff559470ecff5f8db12288f42db3fe2a0489 - U.S. Weather Bureau, Climatological Data, Ohio, July 1920
sha256 0e466033a05b491caf9d20cdaeba1c2087f2b47cb5efd2feb0ef39780fa751c3 - Commercial and Financial Chronicle, 17 July 1920, reprinting the USDA weather bulletin
sha256 d4e8517af989320756b00b582fd982d980f512c31700188f3021a731ac3e3fc5 - Text extraction of the Chronicle crop report
sha256 ae8bd863fe64dbac84311e7bda8e1355275cdc8ae3229f8f574aff415ca5b7e1 - NOAA GHCN-Daily, Dover USC00332270
sha256 635c866b190075a26f48fc2b61f7cec072b9e61609bc65a42055df3d4b52bea4 - NOAA GHCN-Daily, Dennison Water Works USC00332156
sha256 54d45c9ff7afaac3899485a5cb8f6717384a1f7ba0c1f8dfcf7798201eef1252 - NOAA GHCN-Daily station metadata
sha256 14c6467fcce6cce8dc0786eba8bbceed51a2f1c1056b0e221b573157559fc824 - NOAA GHCN-Daily inventory
sha256 fb8a5b7b5bd25b6828fc822e4a4bc2a036053ac5af30697b4df1386a21cb0e59 - NOAA GHCN-Daily file format and flag definitions
sha256 0e4e6f0e6947cf1add884c328a01760f31c56ef5fb86b85ed57dd5dc4c4aeaa6 - OpenStreetMap Nominatim, Zoar village
sha256 e1314ed3e8e201fc056f47c0718cb028d8520e9e5779426b58767dbcf9b99fe0 - Nephos transcription of Dover rain, sky-day counts and source conventions
sha256 747ebf862b114478744831b965c01172c42bf3797e29e46f208c8d9216996b97 - USDA weather bulletin, week ending 6 July 1920, reprinted in the Commercial and Financial Chronicle
sha256 95f2b099bd88b0aac7bff99f6ea956a361910a719501051279ea9d206f7142a1 - USDA weather bulletin, week ending 6 July 1920, reprinted in the Commercial and Financial Chronicle — extracted text
sha256 aa28d17597c1318d4e501458edcd50540c7696157a5594a02b2c24ef7b40d00b - USDA weather bulletin, week ending 20 July 1920, reprinted in the Commercial and Financial Chronicle
sha256 aae4352bc76353a04d8b13bfd63d93c1232682b2a37e2f748c63a59b70f9f7ec - USDA weather bulletin, week ending 20 July 1920, reprinted in the Commercial and Financial Chronicle — extracted text
sha256 48366a7db93554d17a06386a69feda14c98da336ba1814dcafee5bc29a9584fa - USDA weather bulletin, week ending 27 July 1920, reprinted in the Commercial and Financial Chronicle
sha256 25a5f1a2bf2bd89474464256ba3cb41d63de92436165c5ec97fdfcff70d25fc6 - USDA weather bulletin, week ending 27 July 1920, reprinted in the Commercial and Financial Chronicle — extracted text
sha256 4bf837528e94509b18467ebe730bb842a8eab063f918af9171516d15a2f64416 - Canton Museum of Art, Wheatfield in Zoar — museum image
sha256 9b488f3010c6f0868137401014db3cdece0fb0001acafa7416e14fa58b1b3fa7 - NOAA 1991–2020 monthly normals, New Philadelphia USC00335894
sha256 8a289ef58a6fab66dc81fbab0e375593e1610f62213828a4bcf6e30e90bc69c0 - NOAA normals CSV layout and completeness flags
sha256 feb4e1dd5914c8d35eccd017e114c6e5d352b1e217602cb622a67ad6670c3c21 - USDA NASS, Ohio Crop Weather, 6 July 2020
sha256 f47b77524ef00eca50cbc5825a105da61f10252fe58c1e6ccced8ae47d70e94e - Text extraction of Ohio Crop Weather, 6 July 2020
sha256 ec55384ec2f92695dfceead6b55980acb45f9fe149e34cf8b71830ecebf925c2 - Nephos harvest evidence: report dates, scan-checked excerpts and visual interpretation
sha256 d8cf9894f05a2afae7c748535f771096210b625e90be3b8010e59e6a6a37bcd2